Building Dashboards with Grafana MCP and Claude Code
Building Grafana dashboards by hand is tedious. Here's how I use Claude Code and the Grafana MCP to generate them, then provision from GitHub.


Recently I installed a monitoring and observability stack consisting of Loki, Prometheus, Grafana and Alloy into my homelab to get some transparency and insights into all of the services running. Grafana especially has been on my ToDo list for the longest time now, because who doesn’t like some fancy looking numbers and graphs? I sure know I do!
What I don’t like however is the process of building those dashboards. I find it quite annoying and frustrating, so I decided to try and find an easier way to create dashboards. And so I did!
In this post, you will learn how I use Claude Code to create Grafana dashboards, and how to setup Claude Code so you can do the same. I will use Claude to create a Grafana dashboard for Pi-hole, a DNS-level adblocker, for this example. Pi-hole’s metrics get scraped by Prometheus using the pihole-exporter project (https://github.com/eko/pihole-exporter).
Let’s dive in 🪂
Grafana MCP install and configuration
First up is installing and configuring the Grafana MCP server in Claude Code. There are several options available, but I will focus on the simple one-command version. Other methods and general documentation can be found here: https://grafana.com/docs/grafana/latest/developer-resources/mcp/clients/claude-code/
First, install the mcp-grafana binary. If you have Homebrew available, use this command.
brew install mcp-grafanaOtherwise, you can download the release package required for your environment on the GitHub release page: https://github.com/grafana/mcp-grafana/releases
To add the MCP server with it’s necessary configuration to Claude Code, execute this command outside of Claude Code, in your terminal.
claude mcp add-json "grafana" '{
  "command": "mcp-grafana",
  "args": [],
  "env": {
    "GRAFANA_URL": "http://<grafana-url>:3000",
    "GRAFANA_SERVICE_ACCOUNT_TOKEN": "<your-token>"
  }
}'
To get a service account token, navigate here in Grafana:
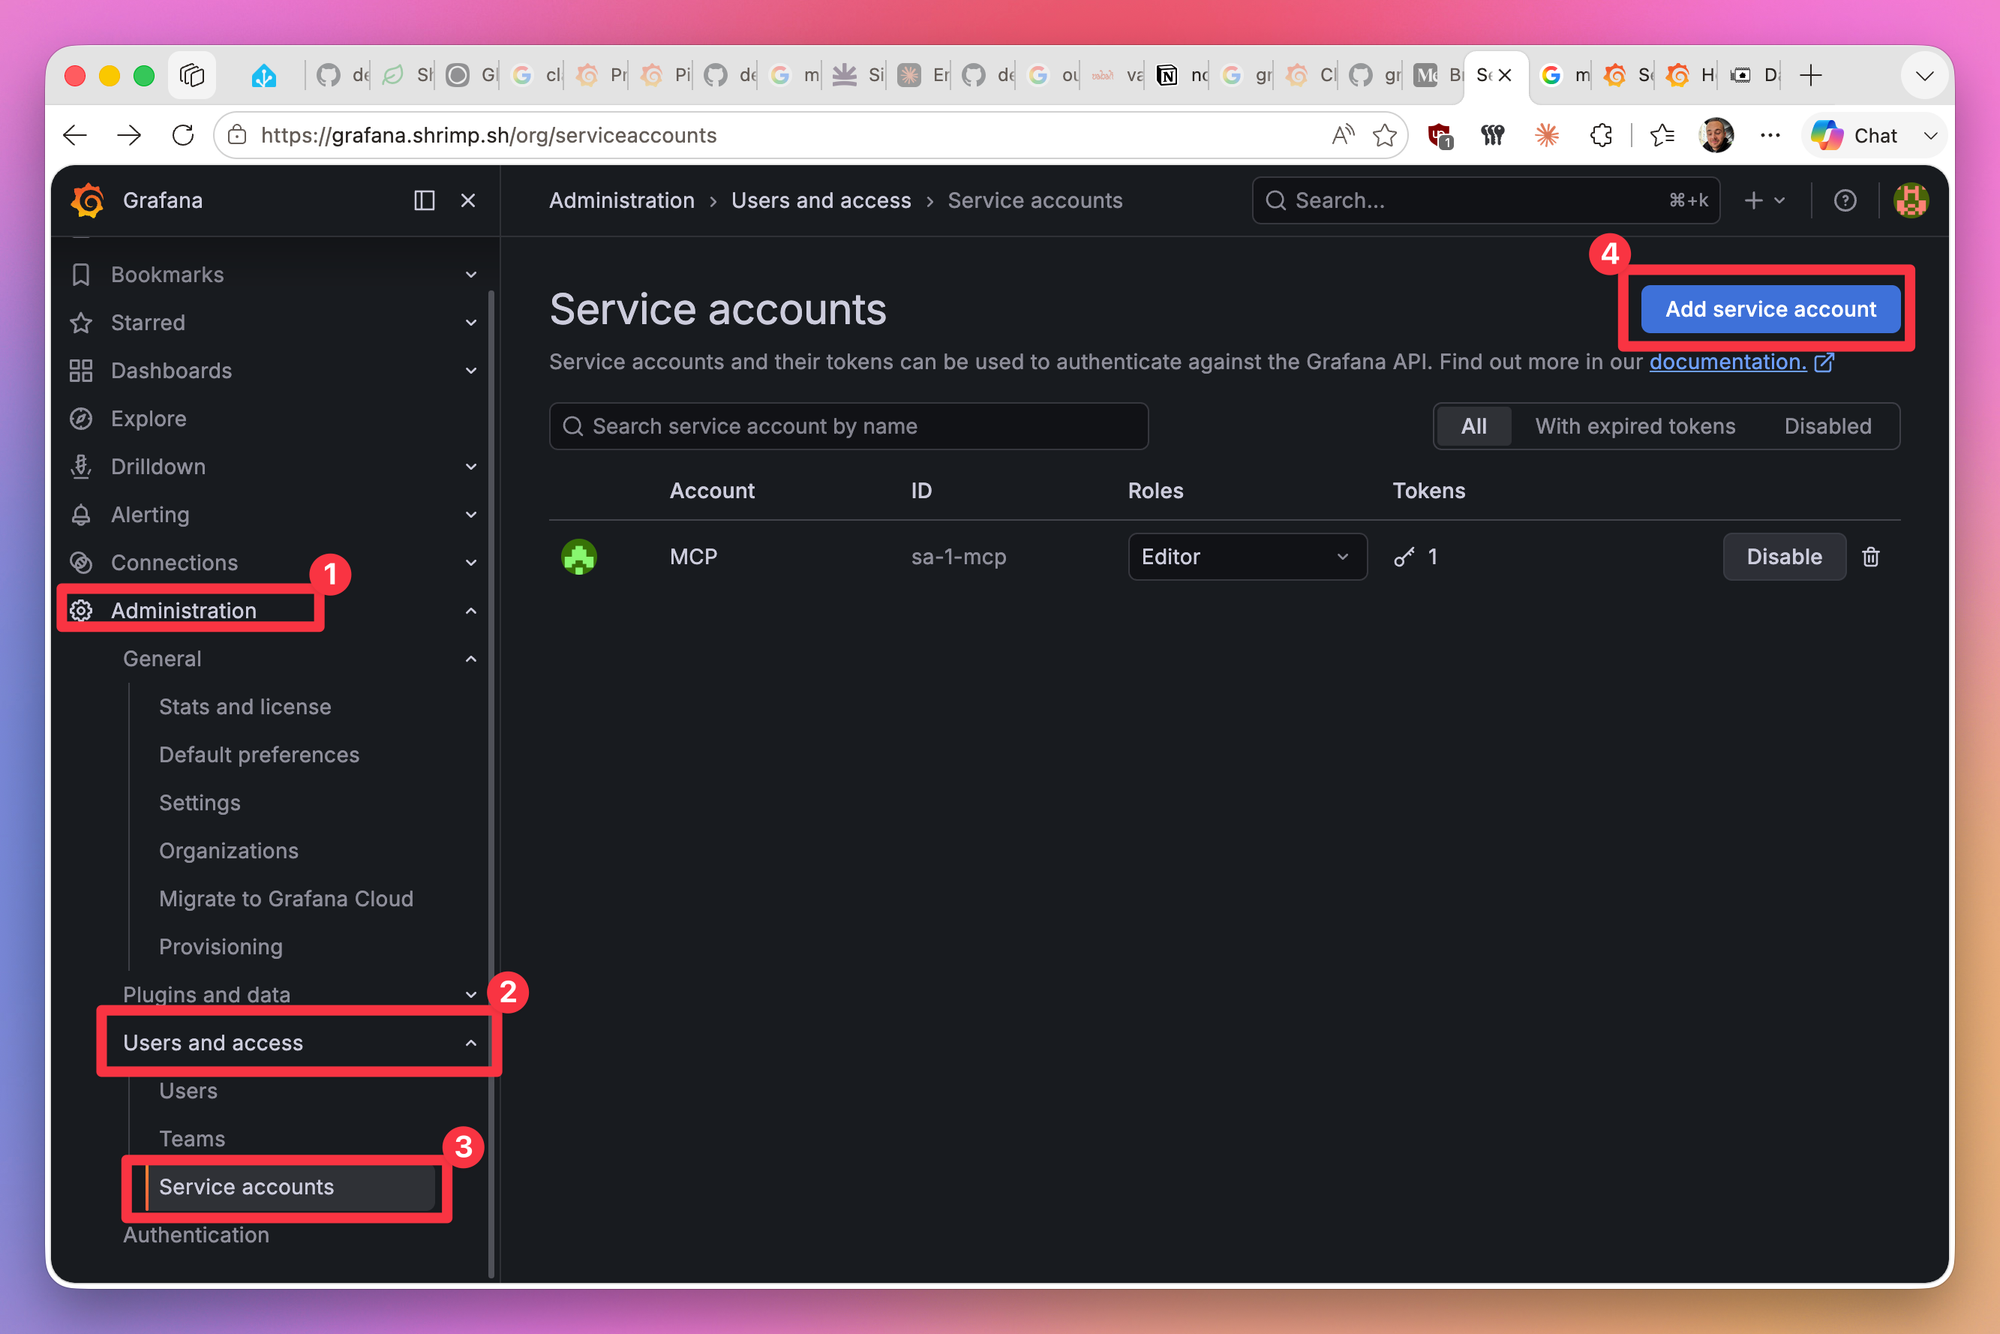
I chose role Editor for the service connection.
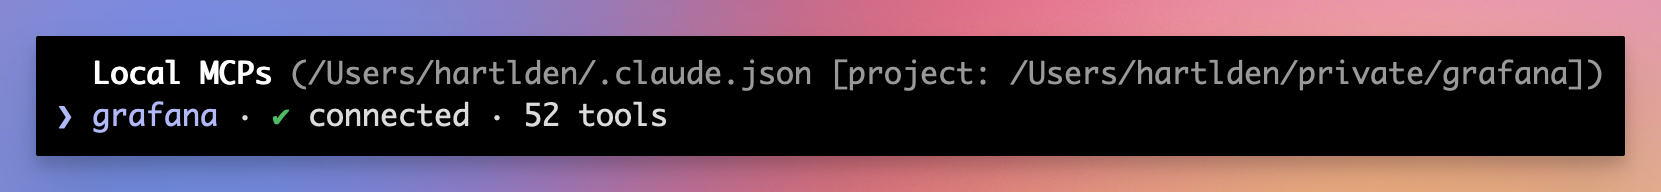
Finally, check the MCP server configuration in Claude Code using /mcp (this time within Claude Code). You should see an entry looking like this:
Preparing Claude (CLAUDE.md)
After installation, I prepared a CLAUDE.md file to give Claude some general guidance.
As a rough guideline, try to include the following things:
- MCP tool - Tell Claude about the Grafana MCP tool to make sure it uses it
- Workflow - Describe how you want Claude to work. I included things like the in-place Grafana ↔ GitHub sync (more on that later), naming guidelines I want Claude to apply to dashboards, …
- Schema Version - Which Grafana schema version (v1 or v2) do you want your dashboards to be built in?
- Datasources - Which datasources are available within Grafana
- Grafana Instance - Infos about the Grafana instance you are connecting to. URL, version, environment, plugins, …
- Domain Context - Specific info about the kind of environment you are working in
Here is my CLAUDE.md to give you an idea:
# CLAUDE.md for Grafana Repo

## Grafana Connection

- You have a Grafana MCP connected when working in this repo. This will allow direct connection to Grafana

## Workflow / source of truth

- This repo both syncs from and to Grafana (two way sync implemented directly in Grafana)
- All additions and changes to dashboards shall be performed in JSON files within the repo, not pushed diretly using the MCP server. The only exception is to use the MCP for temporary pushes for validation
- Use the MCP server of yours to sanity-check after edits (you can push dashboards to Grafana directly with the MCP server)
  - Dashboards manually pushed must have suffix "_testing" added
- Never touch existing dashboards if they are not explicitly part of current work scope
- All dashboards should be created at the root of the repo
- File-naming should be kebab-case
- There is only one Grafana instance, no differentiation between environments
- tag with the service/exporter name and a category like homelab/network/system

## Schema Version

- New dashboards created by Claude should always be created in v2 Kubernetes-style schema

## Datasources

The following data sources are available:

- Loki
- Prometheus

## Grafana Instance

- URL to the Grafana instance: <https://grafana.example.com/>
- Version: latest
- Instance is hosted on a Raspberry Pi via Docker compose
- No plugins installed (but can be changed if meaningful value gets added)

## Domain Context

- Most things which will be displayed are related to small self-hosted services / homelab / private network stuff. No enterprise scope.
Creating the dashboard
Now it’s time to create the dashboard. I always start by creating a Markdown file describing in as much detail as possible how I want the dashboard to look (styling) and also which content I want to see.
For the Pi-hole example, I prepared PIHOLE.md like this.
# Pihole Dashboard Guidance and Requirements

## Data

- Data is pulled using this service: https://github.com/eko/pihole-exporter
- All metrics being pulled can be found by this query in Prometheus: {__name__=~"pihole.*"}
- Additionally, log files are pulled via Grafana Alloy into Loki, which is also connected to Grafana
  - These can be found by filtering for label container=pihole-pihole-1

Please ignore other dashboards regarding pihole being present.

## Dashboard requirements

	The following metrics must be added to the dashboard (more sensible additions are very welcome):

- Amount of blocked DNS requests today
- Percentage of blocked DNS requests
- Amount of clients
- Amount of queries (separated by type, but I also want to see the total easily)
- Amount of Domains being blocked
- Cached vs forwarded queries
- Top domains being queried
- Top domains being blocked
- Top sources for DNS queries
- Logs of the container

Also add a (hidden by default) section for the forward destinations, including which they are and their response time
Instead of painstakingly describing each of the metrics which Prometheus pulls in, I just added some instructions for Claude to check the metrics himself, based on a simple Prometheus query. Make sure data is flowing before implementing the dashboard of course, otherwise this approach will not work.
As for styling, I had Claude create a dedicated STYLING.md file I can reference for future dashboards.
# Dashboard Styling Guide

Notes on the visual conventions used in `pihole-homelab.json`. Use this as a reference when building or revising dashboards in this repo.

## Schema and structure

- **v2 Kubernetes-style schema** (`apiVersion: dashboard.grafana.app/v2`, `kind: Dashboard`). Everything lives under `spec`.
- **Panels are stored in `spec.elements` as a map** (`panel-1`, `panel-2`, …). The map keys are referenced by name from layout items — IDs don't have to be sequential, and reordering the visual layout never requires renumbering panels.
- **Layout is a `RowsLayout` of `RowsLayoutRow`s**, each containing its own `GridLayout`. Each row has its own coordinate system (x/y start at 0 inside the row).
- **Grid is 24 columns wide**. Standard sizing rhythms used here:
  - Stat cards across the top: `width: 6` (4 per row) for the most important KPIs, `width: 8` (3 per row) for secondary KPIs.
  - Side-by-side charts: `width: 12` (e.g. top queried + top blocked tables).
  - Full-width panels: `width: 24` (cached-vs-forwarded, top clients, logs).
  - Heights: stat cards `4`, regular charts `8`, tables `10`, logs `12`.

## Hiding a section by default

Collapse-by-default rows are just `collapse: true` on the `RowsLayoutRow.spec`. The nested panels still load but stay folded until the user clicks the row header. Used here for the "Forward destinations" row.

## Color philosophy

Color is meaning, not decoration. Pick a fixed color per metric class and stick with it:

| Class | Color | Examples |
| --- | --- | --- |
| Blocked / threat | red | Blocked today, Top blocked domains |
| Neutral count | blue | Queries today, Active clients, Top queried domains |
| Health / good state | green | Status: Enabled |
| Health / bad state | red | Status: Disabled |
| Percentage thresholds | green → yellow → orange | Blocked % (0 / 10 / 30) |

Apply via `fieldConfig.defaults.color.fixedColor` for single-color panels, or `thresholds.steps[]` when the color depends on value.

## Stat panels

A few small choices make stat cards feel intentional rather than auto-generated:

- **`graphMode: "area"`** for KPIs where trend matters (Blocked today, Blocked %, Queries today) — adds a subtle sparkline behind the number.
- **`graphMode: "none"`** for stable counters (Clients ever seen, Domains on blocklist) where a sparkline would just be noise.
- **`colorMode: "background"`** for state indicators (Status panel) — the whole card lights up green/red. Pair with `textMode: "value"` so the mapped label ("Enabled" / "Disabled") fills the card.
- **`colorMode: "value"`** for numeric KPIs — only the number is colored, keeping the card calm.
- **Value mappings** convert raw numbers to human labels (`0 → Disabled`, `1 → Enabled`) with their own color, independent of the threshold color.

## Time-series panels

Defaults that consistently look good:

- `lineInterpolation: "smooth"` (avoid the jagged "linear" look unless the data is genuinely discrete).
- `fillOpacity: 15–25` with `gradientMode: "opacity"` — gives the area-under-line a soft fade instead of a flat block.
- `lineWidth: 1` for stacked series, `lineWidth: 2` for emphasis lines (e.g. response time).
- `showPoints: "never"` — points clutter dense data.
- `legend.displayMode: "table"` with `calcs: ["mean", "max"]` or `["max", "mean"]` — gives a real legend that doubles as a summary table.

### Stacked with a "total" overlay

In "Queries by type", the per-type series are stacked (`stacking.mode: "normal"`) while a second query (`sum(pihole_querytypes)`, legend `total`) is rendered unstacked on top as a thick white line. This is done with a field override on the `total` series:

- `custom.stacking → { group: "B", mode: "none" }` — different stacking group, no stacking.
- `custom.lineWidth → 2`, `custom.fillOpacity → 0`, `color → fixed white`.

Pattern: when you want a "total" reference line over a stacked chart, give it a different stacking group and override its visual config.

## Tables

Tables are used for top-N lists rather than bar charts because they're more information-dense and look cleaner on a dashboard:

- **Numeric column as gradient gauge**: field override on the value column with `custom.cellOptions → { mode: "gradient", type: "gauge" }`. Each row's number becomes a horizontal bar inside its cell, scaled to the column max — instant visual ranking without losing the actual number.
- **Color the gauge to match meaning**: blue for neutral counts, red for blocked.
- **Organize transform**: drop Prometheus internals (`__name__`, `hostname`, `instance`, `job`, `Time`), reorder the columns you keep, rename `Value` to something readable (`Queries`, `Blocked`, `Response time`).
- **Sort transform** for explicit descending order on the value column.
- **Merge transform** when joining two `topk`/instant queries on the same label set (used for the Destinations table to combine query count with response time).

## Piecharts

- `pieType: "donut"` — softer than a full pie and leaves room for a center display if needed later.
- Legend on the right with `values: ["value", "percent"]` — both the absolute number and the share, since either alone is misleading.
- Donuts are reserved for distributions (query type, destination share), not for things that should be a stat or a bar.

## Logs panel

Loki container logs at the bottom of the row, full width, height 12. Key options:

- `sortOrder: "Descending"` — newest first.
- `wrapLogMessage: true` — long log lines wrap instead of getting truncated.
- `enableLogDetails: true` — clicking a log line expands its labels and fields.
- `showTime: true`, `showLabels: false`, `showCommonLabels: false` — timestamp visible, label noise hidden.

## Layout grouping

Rows group panels by user intent, not by data source:

1. **🛡️ Overview** — single-glance KPIs.
2. **🌐 Queries** — what's actually being queried, charts and top-N tables, plus the live log tail at the end of the row.
3. **🛰️ Forward destinations** — the deeper "how Pi-hole is talking to upstreams" view, collapsed by default so it doesn't compete with the overview.

Row titles use emojis as visual anchors — easier to scan than text-only headings, and they survive Grafana's default styling.

## Naming and tags

- Dashboard JSON filenames are kebab-case at repo root.
- `metadata.name` matches the filename without extension.
- Tags follow the convention from `CLAUDE.md`: exporter/source first, then categories (`pihole-exporter`, `dns`, `network`, `homelab`).

## Datasource references (v2 schema gotcha)

In v2 schema, `query.datasource.name` actually holds the datasource **UID**, not the display name. This matters when the UID differs from the plugin type — Prometheus happens to have `uid: "prometheus"` so the value `"prometheus"` works either way, but Loki's UID is `P8E80F9AEF21F6940`. Use the UID.

## Time settings

- Default range `now-24h` to `now` — long enough to see daily patterns, short enough to load fast.
- `autoRefresh: "1m"` — quiet enough not to flicker, fresh enough for a live ops view.
- `timezone: "browser"` — match whoever's viewing.

## Filtering exporter quirks

`pihole_forward_destinations` and `pihole_forward_destinations_responsetime` include pseudo-destinations `blocklist` and `cache` alongside real upstream resolvers. The forward-destinations panels use `destination!~"blocklist|cache"` so they only show actual upstream DNS servers. Document quirks like this in the dashboard description or panel description rather than burying them in queries.
With my requirements and styling guide being ready, all that’s left is to start a Claude Code session in plan mode with this prompt.
Please plan implementation for a new dashboard based on user requirements defined in @PIHOLE.md
Reference @STYLING.md for general styling advice
With the information in hand, Claude will run off, and plan the dashboard implementation.
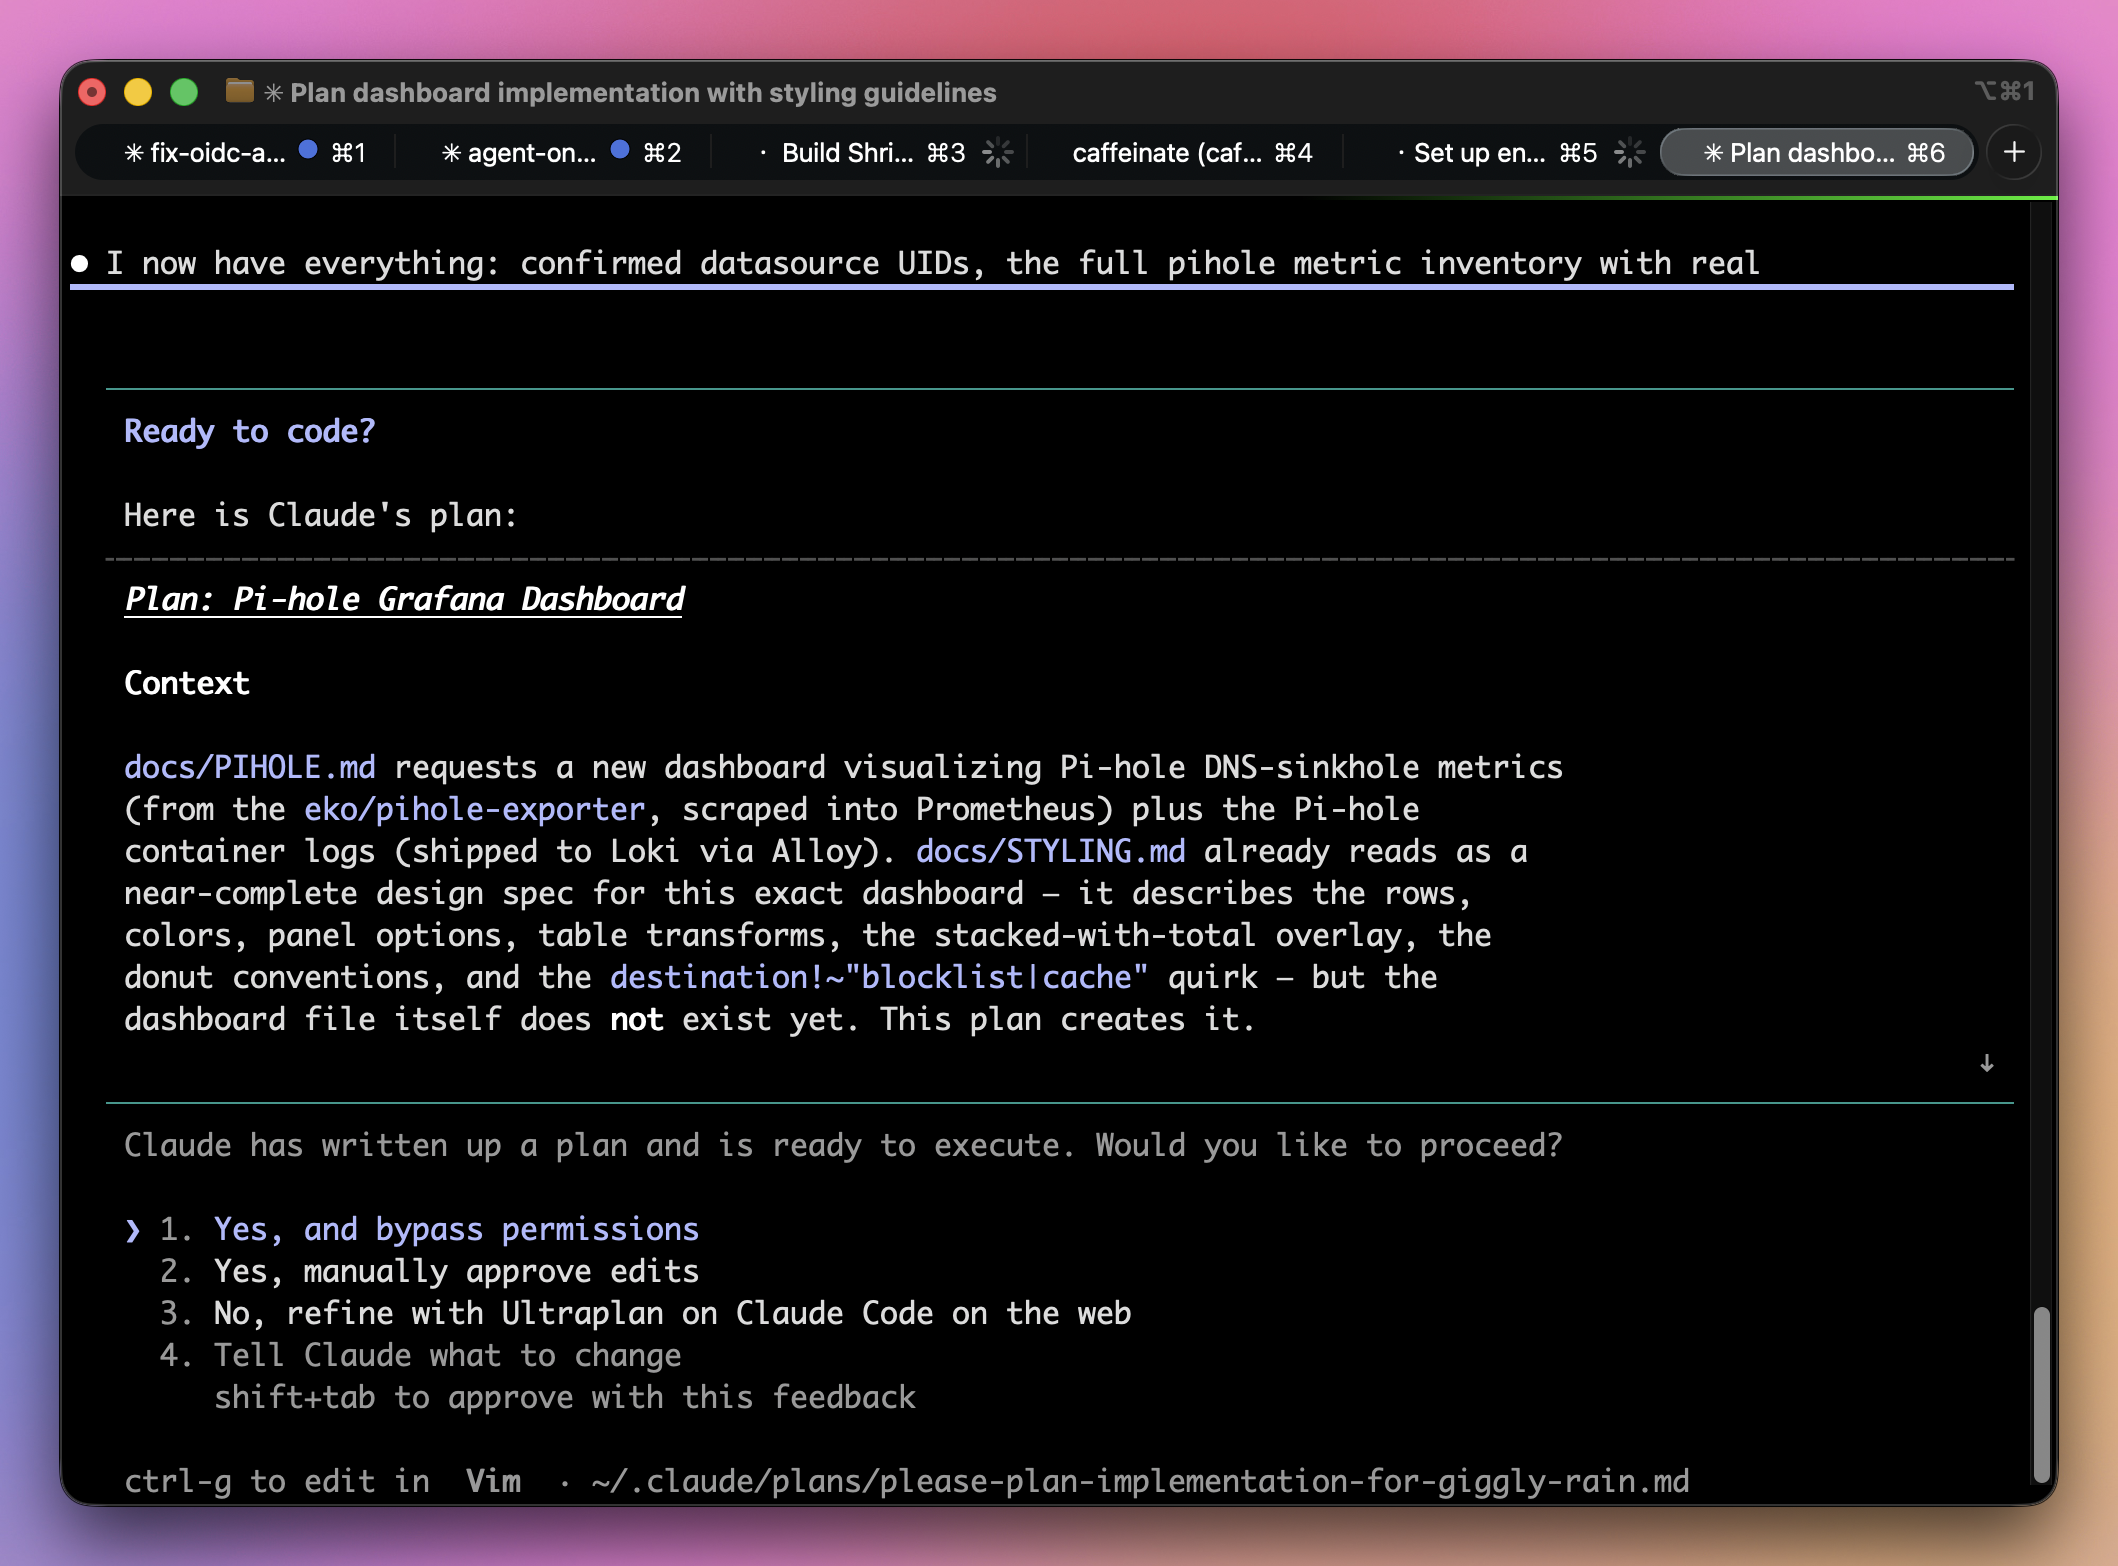
Review the plan, and once Claude and you are happy, let Claude push the dashboard directly into Grafana via the MCP server OR use the Grafana provisioning service from GitHub (see next section).
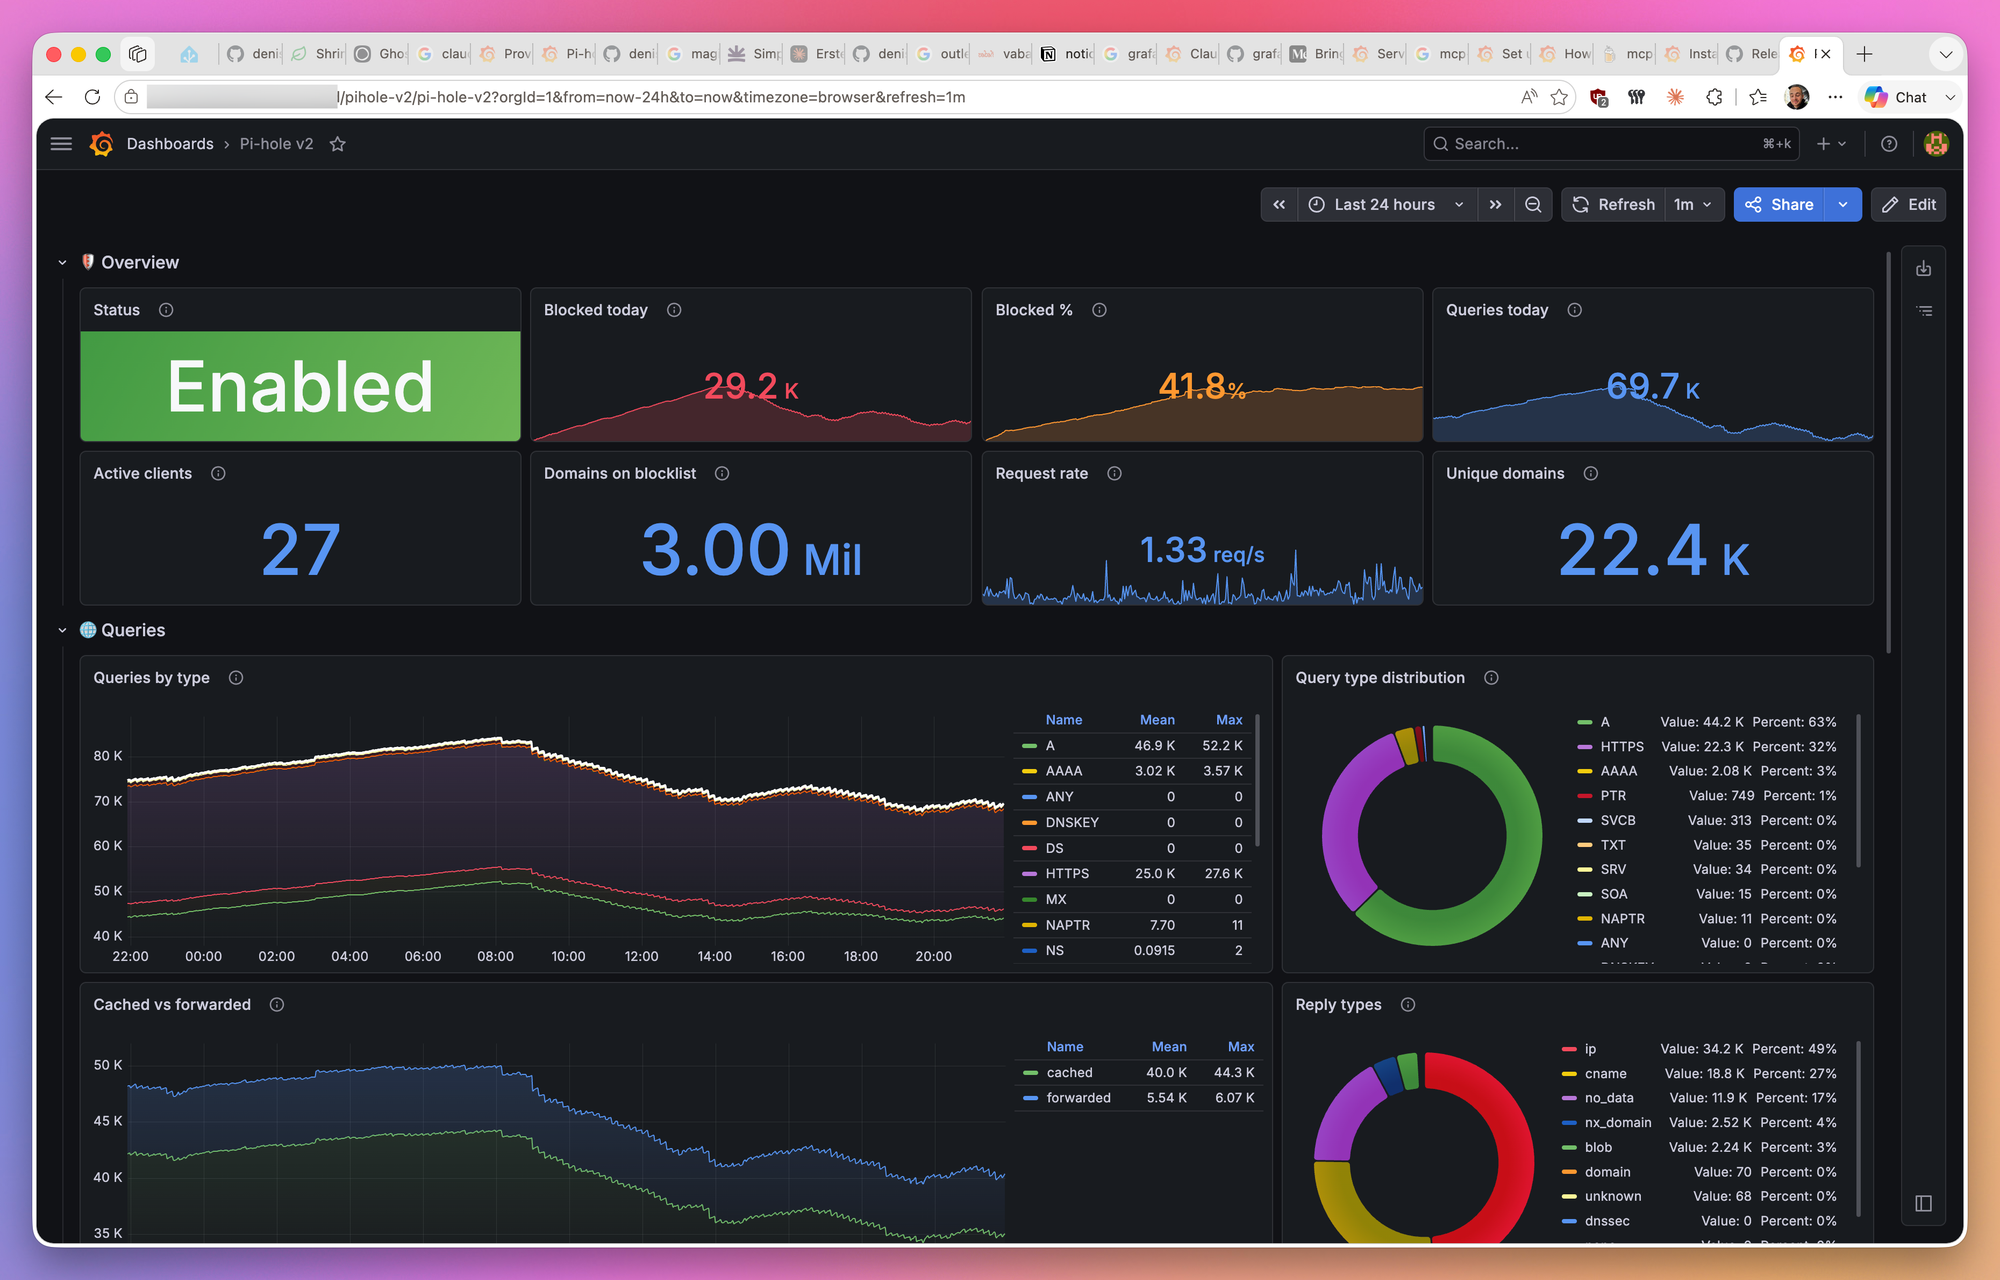
This is what my v1 dashboard, implemented by Claude, looks like:
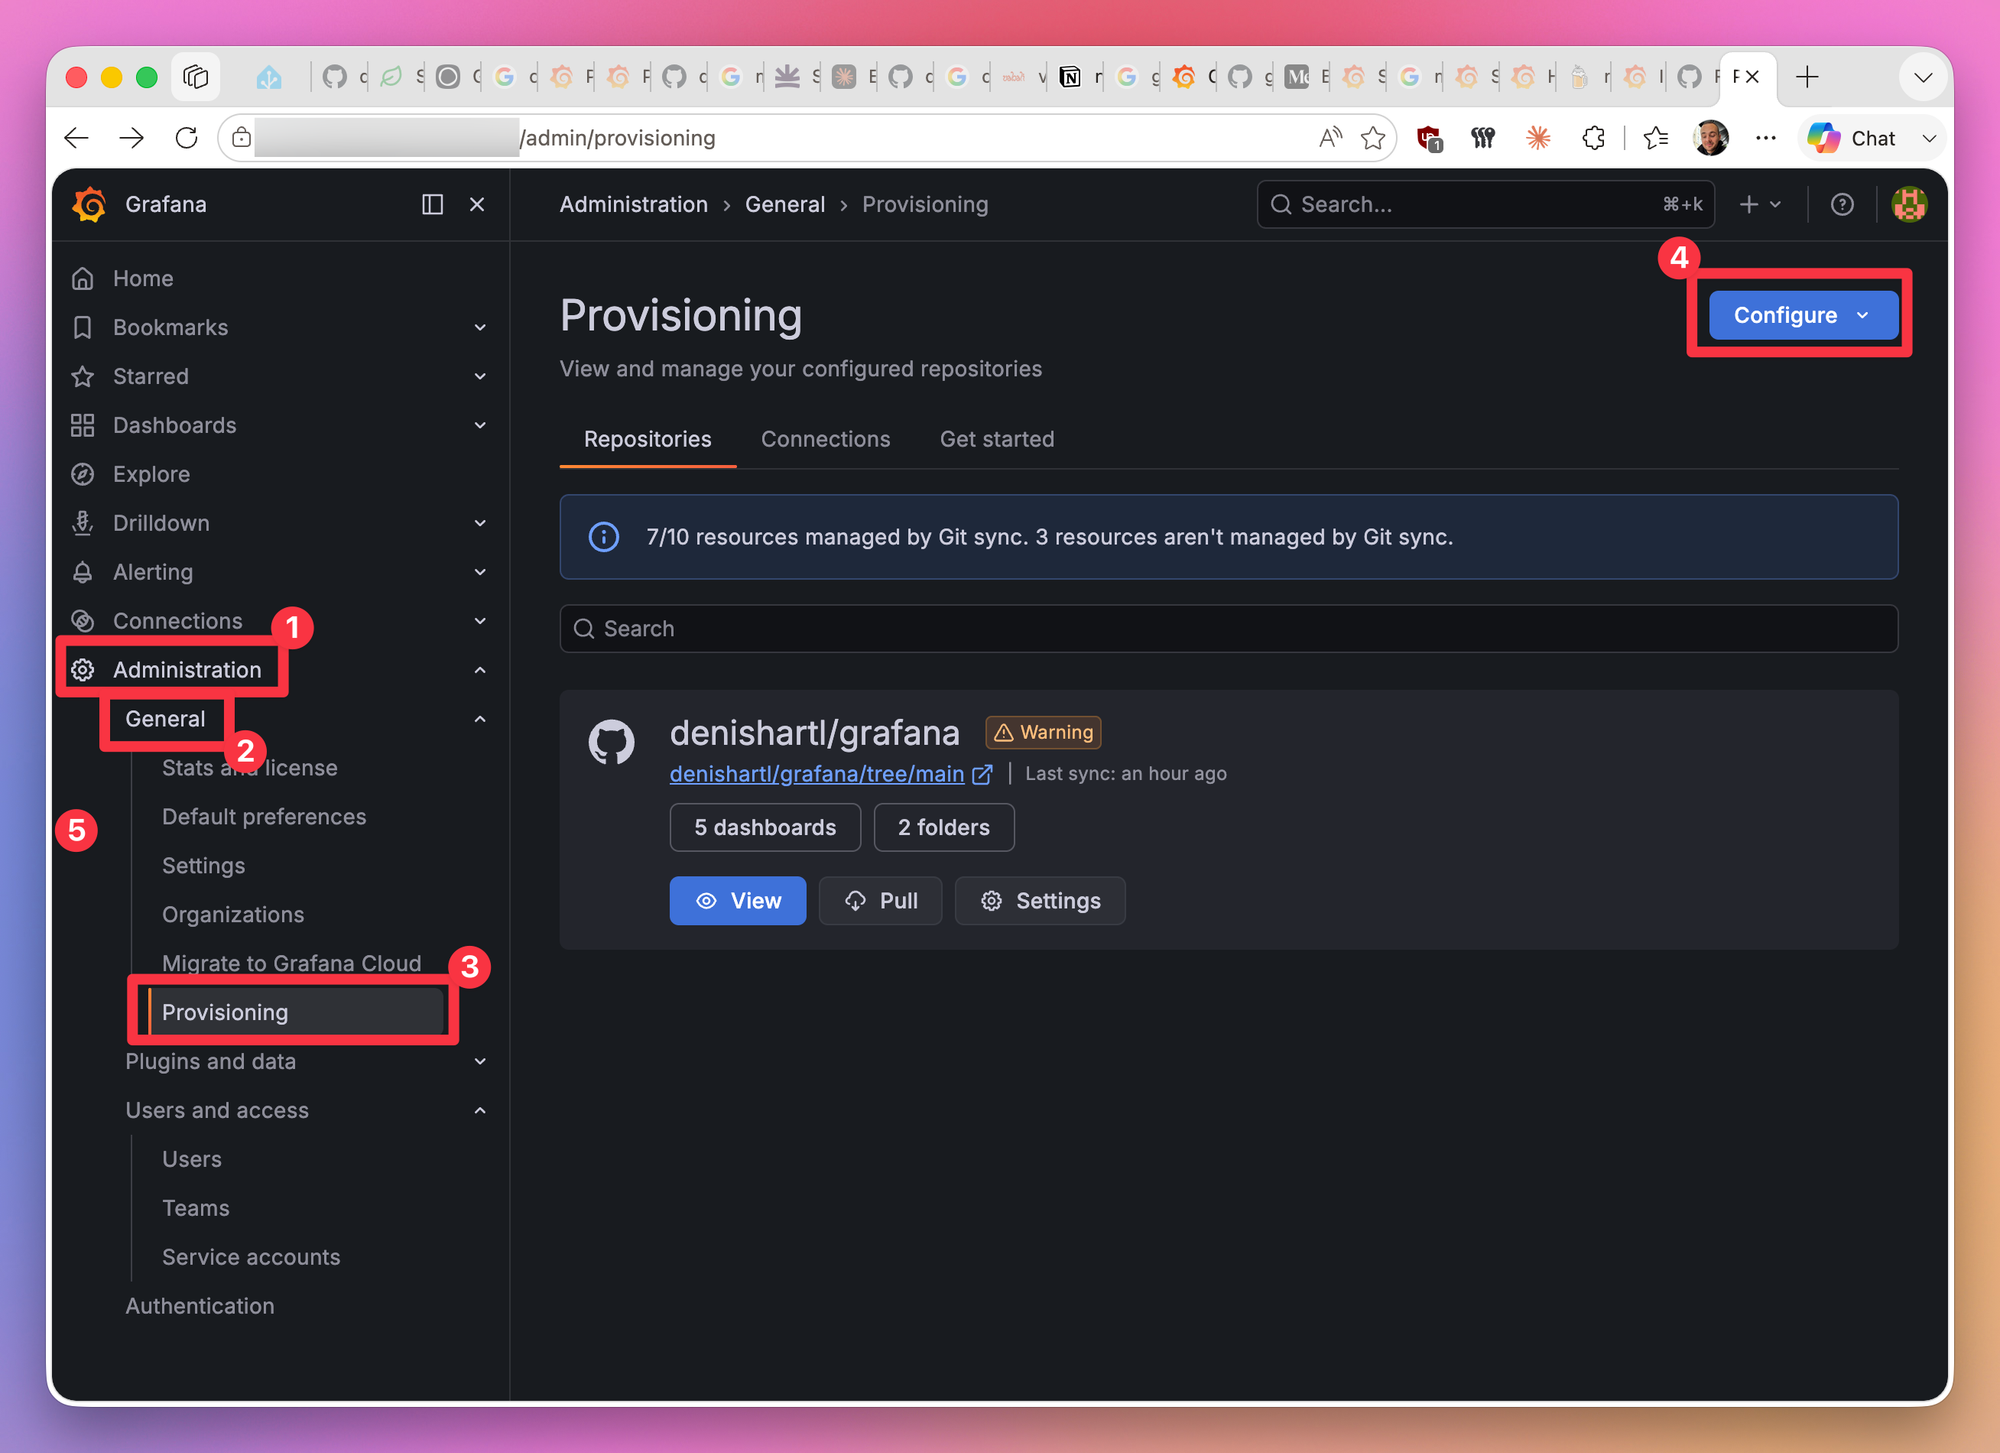
Bonus: Grafana provisioning from GitHub
Grafana offers the option to provision content directly from a GitHub repository. To configure, navigate here:
The use of this provisioning service offers a few benefits:
- I can have a central repository where I keep my
CLAUDE.mdandSTYLING.mdfiles, together with my dashboards - everything in one place. I can run Claude Code in the repo with required context, without manual setup every time - Externalizing dashboard configuration outside of Grafana to GitHub enables automatic
gitversion control for dashboards - Easy recovery in case of Grafana service issues
The one downside I found so far is that you can’t provision things like alert rules in the same way. As far as I know, this method works only for dashboards (so far).
Wrapping up
I hope this post was interesting and/or useful to you.
What do you use Grafana for, which dashboards do you have? Maybe even tried to have Claude Code work with Grafana too? What’s your experience? Let me know in the comments, together with any other thoughts and feedback ❤️
Thanks for taking your time to read this post! If you liked it, I’d really appreciate it if you share this post. 🔥
Until next time! 👋
Further reading
- Grafana: https://grafana.com/
- Grafana GitHub sync setup: https://grafana.com/docs/grafana/latest/as-code/observability-as-code/git-sync/git-sync-setup/#configure-with-github
- Claude Code: https://code.claude.com/docs/en/overview
- Pi-hole: https://pi-hole.net/
- Pi-hole exporter: https://github.com/eko/pihole-exporter